
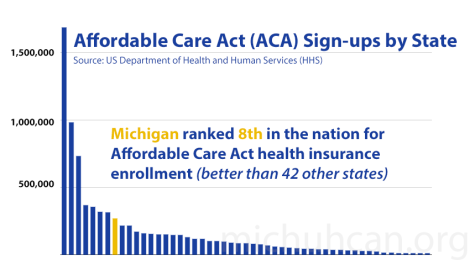
Michigan ranked among the top ten states nationwide for the most ACA enrollment sign-ups between October 1st and Aptil 19th, 2014. (Source)
Michigan ranked among the top ten states nationwide for the most ACA enrollment sign-ups between October 1st and Aptil 19th, 2014. (Source)

Last updated 03/19/15:
There are countless reports, maps, and statistics that demonstrate Detroit’s population changes over the years as well as the city’s decline. What is often overlooked in these figures are the social inequalities that fueled Detroit’s continued racial inequity. Structural racism is not easy to explain in a sound bite, but it has kept the scales tipped against Detroit’s black population for the last century. The effects of structural racism can be seen in the decades of black Detroiters being relegated to lower end jobs, rarely being promoted, being the first to be laid off, and being targeted for subprime mortgages.
Detroit’s revitalization is completely one-sided. The surge in investment in this majority black city is not going to black residents. I began noticing a troubling trend. First, at Whole Foods one out of the ten featured suppliers were black. Then again when the 2013 Detroit Design Festival interviewed designers and one out of eight were black. A recent United Way campaign featured eight Detroit leaders and only two were black. I could only wonder why these revitalization efforts were so lopsided. Finally, I couldn’t help but cringe at TEDxDetroit 2013 where 80% of attendees were white coming up with “solutions” for Detroit, an 83% black city. To top it off, Wayne State University’s student population doesn’t even reflect the city with almost 50% white students and 20% black with only 9% of black students graduating in 4 years.
I’m not alone in my concerns either. There is overwhelming evidence that our cities are becoming more segregated and unequal. Not to mention the racist mortgage lending practices of our country’s largest banks decimating black home ownership in major cities, specifically in Detroit. One journalist has asked “Is there room for Black people in the new Detroit” and others have lamented “Detroit doesn’t need hipsters to survive, it needs Black people.” The New York Times received a lot of push back after a travel piece only featured White-owned businesses in Corktown which then brought out a counter article, “Black-owned businesses are quietly fueling Detroit’s resurgence, but no one’s talking about it.” Aaron Foley recently wrote an excellent piece for Bridge magazine, saying:
“When “new” is basically used as code for “white” in a city where the “old” is “black,” it can drive someone like me [a black person in Detroit] to think they’re obsolete.” – Aaron Foley
There is a very real concern over the shifting interests and populations within Detroit where the benefits of gentrification do not trickle down, but rather force more hardship on those who cannot pay to play. Increased property values don’t solve poverty or crime, they just make poverty and crime more concentrated.
Last year, I began attempting to track and quantify the issue within Detroit’s revitalization as it relates to racial inequity. After working for 3 years with families across Detroit, I couldn’t help notice the absence of long-time Detroiters in development discussions, funding proposals, and the new “benefits” of a growing Detroit.
The title of this post, Black Problems, White Solutions, is a reflection that in Detroit problems are seen as being caused by black people, but the solutions are being powered by white people, neither of which are true.
My first challenge was that there is no demographic data (race, gender, age) published by small start-ups or even large corporations, or nonprofits. This meant that I would need to find the data myself. How could one white male possibly determine the race of hundreds of individuals involved in Detroit’s revitalization? short answer: I can’t.
My next challenge was that I had to construct ideas about race in order to categorize individuals. I was extremely hesitant because I know that race is socially constructed, that individuals self-identify in very different ways, and that identity can and does change over time. It is important to note that discrimination affects minorities no matter how one self-identifies. Over a period of July – August 2014, I combed the websites of Detroit companies and start-ups for information about their staff. I, obviously, had to base my categorizations on my own assumptions and perceptions of race. I pulled headshots from individual biographies posted publicly on fellowship programs, academic profiles, and many “About” pages. All this data was then compiled into the database that I later analyzed.
My analysis brought to mind the PBS project where user can sort photos of individuals by “race” where the main takeaway was:
“Classifying them [headshots] into groups is a subjective process, influenced by cultural ideas and political priorities.”
The article “Stereotypes drive perceptions of race” demonstrated that changes in racial categories “were driven by changes in the people’s life circumstances and common racial stereotypes.” There is also evidence that Latino individuals often choose to check the “White” box on the Census form as a sign of status. There is a similar issue where “Arab” populations are lumped into the “White” category by the Census Bureau. Our official systems to categorize race are both flawed and inadequate.
Note: “American Indian” was excluded even though there were around 2,500 individuals living in Detroit from the 2010 Census, the American Indian population makes up less than 0.5% of the total Detroit population, but also bore the brunt of early slavery in Detroit.
What I found, unfortunately, confirmed what I had been seeing. Detroit’s revitalization is made up of a majority of white people. That isn’t to say that Detroit’s black population isn’t contributing anything to revitalization, rather it suggests that there is a deliberate racially unequal distribution of support and funding. In total 818 individuals were identified from fellowship programs, business incubators, universities, foundations, and other “innovation” programs.
Across all of the programs 69.2% of individuals were classified as White and only 23.7% as Black (1.6% Latino, 4.8% Asian, 0.7% Arab). Looking at this new data, it is clear that there is a serious imbalance of both opportunity and outcomes in Detroit.

The majority of programs and institutions that were checked were grossly out of balance in terms of racial equity. The only program that had less than 50% white individuals was the D:hive BUILD small business incubator. The Urban Innovation Exchange featured profiles also came close, but tended to feature 50% white individuals and 50% of all other races. The Wayne County Community College District notable had the most black Presidents and Vice Presidents.
Those who hold the decision-making power with private funds, institutions of higher learning, and foundations support members of their own race rather than the majority race of the residents of Detroit.
Note: The degree to which other minority groups besides “black” are under-represented is also a compelling result that warrants further investigation.
In many ways Detroit has become the national test case for various issues: municipal pension issues, economic decline and resurgence, as well as monetizing or privatizing city services. There is potential for Detroit to become the test case for racial equity in urban centers. Detroit is at the very beginning of its efforts to revitalize and reinvest. During this period it is critical to ensure there is a structure that promotes equity in training, hiring, bidding, and selecting individuals who are the city’s present and will be it’s future. This is the critical moment where Detroit should try to lift all residents and not just those who can drop multi-millions for an expressway ramp or swoon decision-makers with a new stadium plan.
Mayor Duggan has said that every neighborhood has a future, but does every neighbor have a future in Detroit?
Detroit can build itself to be the city that prioritizes its people first by going beyond “community engagement.” If the city pushes for a strong community based redevelopment model from the bottom-up it could allow for a more racially equitable path forward. The city and its various supporters need to both ask Detroiters what they want to see in their communities and give them the tools, training, and support to make it happen. There is no reason that community development can’t also lead to citywide revitalization.
Thanks to the many people who gave me comments and feedback throughout the process of putting this together.
The ice bucket challenge was undoubtedly a media and fundraising success for the ALS Association. For many people this was an opportunity to “do good” and call out their friends on social media to do the same. Skepticism mounted as social media feeds were inundated with ice bucket participant videos.
Plenty Consulting looked at the data and found that daily donations to the ALS Association (ALSA) remained the same even as the number of ice bucket challenge participants grew exponentially. Donations to the ALS Association were 35% higher than last year, but were all the non-donating participants missed fundraising opportunities or simply “do good” imposters? Perhaps it is helping to foster a culture of giving?

Vox published a widely shared bubble chart (above) that demonstrated which diseases kill the most people compared to which diseases get the most donations. This chart is flawed in the sense that comparing one-time fundraisers, such as a Breast Cancer Walk, isn’t enough to capture which diseases get the most overall funding.
Others took a more statistical approach to their skepticism. One individual (redditor SirT6) chose to look at NIH funding and disability-adjusted life years (logarithmic) to compare some of the top diseases that get funding compared to their impact on lifespan.

I think both measures in the above chart are flawed in that NIH funding is a poor indicator of where the general public is donating and also it is nearly impossible to compare the suffering and impact of each individual disease through adjusted life years.
Instead I chose to identify the largest charity for each of the top 15 diseases that kill people in the US (excluding #5 unintentional accidents) based on the 2011 National Vital Statistics Report from the Centers for Disease Control (CDC). A few charities took on multiple diseases, such as the American Heart Association (AHA) working on heart disease (#1) and stroke (#4) or the American Lung Association (ALA) covering lower respiratory disease (#4), pneumonia (#8), and lung inflammation (#15). By searching the most recent IRS Form 990 from each charity I looked at their Total Revenue (fiscal year) as well as the percent of the Total Revenue that came from Contributions (fundraising, grants, etc.). I figured this gives the best indication of where both individuals and other foundations or nonprofits are giving their donations. I then compared each disease/ cause of death in its “per 100,000” prevalence rate.

The size of the bubble represents the percentage of total revenue that comes from donations. The big take away here is that some of the most deadly diseases are getting larger amounts of funding. However, there are a handful of diseases that definitely aren’t getting enough (i.e. Septicimia), but are three times as deadly as ALS. Lung diseases really aren’t getting a lot of donations, but seem to remain highly funded regardless. In my research for this I was surprised to find that HIV/AIDS per 100,000 rate is less than ALS at 2.5. In particular areas, such as Detroit, HIV/AIDS is a much larger problem, but it is good to see that advances in treatment and prevention have lowered the national rate.
The majority of charities depend on contributions and donations to fund their efforts, pay salaries, and cover expenses. It is difficult to say what percentage is used for prevention activities or for finding a cure, but very obviously not all diseases are funded equally. Likewise, not all diseases contribute to the deaths of people at the same rates. Does that mean some should get more funding over others?
“Orr on Wednesday said more needs to be done to differentiate the legitimate residential accounts from those connected to blighted and abandoned properties, or occupied by squatters or used as drug houses — conduct that the city doesn’t want to facilitate.” – Detroit News
Following the most comprehensive survey of Detroit property to date, Motor City Mapping, the above quote from Emergency Manager Orr should be a moot point. It would take less than a few hours to check a list of delinquent water accounts against a list of “vacant” or “unoccupied” properties across the city. Mayor Mike Duggan and Detroit’s new Chief Information Officer (CIO) Beth Niblock seem to be on board with opening up the city’s data as well as utilizing more technology to better provide services to residents.
Here is my short list of data that should have been utilized to better serve Detroit residents as opposed to penalizing them or resorting to scare tactics.
1. Motor City Mapping: In the most comprehensive citywide parcel survey ever conducted, a host of Detroit data focused organizations have compiled an incredible set of data and they have released it openly to the public. As Detroit works to revolutionize its technologies how did it miss the boat in utilizing this recent, widely publicized data survey. Again, it would take less than a few hours to check a list of delinquent water accounts against a list of “vacant” or “unoccupied” properties.
2. Census Bureau Data: Detroit residents are over 30% unemployed and 40% living below the poverty line. Many residents of Detroit are individuals who have been unable to leave, but have made it through Detroit’s toughest times. Detroit is a man-made disaster zone that has evolved slowly over the course of six decades. The city and the problems that residents face lay bare the inadequacies of our current systems to serve all residents. Neither the city government nor the emergency manager can rely on punitive actions to do any good for current or future Detroit residents.
3. District Managers and Community Networks: The DWSD contracted out door-to-door residential water shutoffs to a profit driven corporation. Any community organization in the city will tell you that mailing notices to residents is not enough. Many community organizations utilize a network of contacts and pay street teams to spread the word about community programs. Would it have really been that hard to do some basic canvassing to get people set up with assistance instead of just shutting off water completely? Why weren’t the new District Managers utilized?
Emergency Manager Orr and Mayor Duggan truly need to take a lesson from Detroit Mayors past who instead of making harmful decisions chose to serve the needs of residents first. Mayor Pingree utilized vacant land to feed the hungry and launched new programs for the poor during the 1893 economic depression. Mayor Murphy supported 400 acres of gardens and turned old factories into housing for the homeless during the Great Depression.
At this time of Detroit “revitalization,” when will Detroit’s decision-makers demonstrate that keeping people (both wealthy and poor) in the city will be better for Detroit’s future. Instead of these harmful actions, the Detroit government needs to push for greater people-centered innovation to serve all residents.

I’ve been actively engaged in tracking homicides in Detroit for a few years now thanks to the efforts of Cham Green and the independent Detroit Crime and Homicide Group, which has spent the last years combing news articles, Detroit Police Department (DPD) major crime reports, and checking these against FOIA requested homicide numbers. There is no other comprehensive or working system to keep track of crime and homicide in the City of Detroit.
The Detroit Free Press requested homicides in 2011 as part of a FOIA. The data they obtained went back to 2008 with about a dozen cases from 1970 and 1980s. Needless to say, the FOIA made it evident that the City of Detroit was seriously lacking in its ability to keep track of crimes and report them in an accurate and timely manner. I can’t say that I’m surprised with the regular cost cutting within the DPD…
View original post 397 more words

411 homicides, 1130 active liquor licenses, 350 city parks
The goal of this map is to demonstrate the relationship between homicide, locations where alcohol is sold/ consumed, and community green spaces.
Research shows corner stores/ convenience stores don’t necessarily have a negative effect on violent crime. However in higher income neighborhoods corner stores are seen as a positive, while the opposite is true in lower income neighborhoods. I also began noticing that a number of homicides occurred at or near clubs and liquor stores.
A great deal of research has also been conducted on the benefit of turning vacant lots into parks or green spaces in order to reduce violent crime. The most important aspect of this, however, is that community parks are beneficial in reducing violent crime when they are maintained. Many city parks in Detroit are not able to be maintained.
I wonder if Greening of Detroit has…
View original post 77 more words

