

How far have we come for racial equity in Detroit? Better yet, what is owed to Indigenous and Black Detroiters as the reparations task force begins meeting? Proposal R to form the reparations task force garnered the most votes from Detroiters (more votes than even Mayor Duggan received) during the 2021 election.
“Detroiters still see and experience racial inequity.”
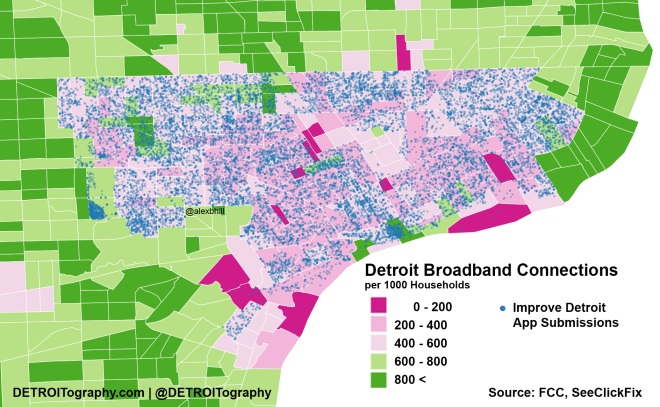
Infrastructure for broadband internet and electricity distribution exacerbate spatial racism. The metro Detroit health care system was dubbed the “most racially segregated” in the country while nonprofit leadership in the city remains racially under-represented. Detroiters are furious that their own city government over-assessed them by $600 million in property taxes and are eager to see what a Reparations Task Force can achieve. Black developers continue to be overlooked for funding and whites continue to get over half of all mortgages in the city. In many cases, Black Detroiters continue to feel left out of the city’s rejuvenation, either by design or by de facto neglect.
Recently, Detroit has seen multiple racial equity reports released. A new effort, Detroit Equity Inc. with Wayne State University, recently released their Detroit Equity Report at the “Detroit Equity Symposium.” Detroit Future City hosted their third “Equity Forum” where their new Center for Equity, Engagement, and Research presented data from their Economic Equity Dashboard. New Detroit Inc. held their annual racial equity conference in October and publishes a semi-regular data report on racial disparities. Lastly, the City of Detroit convenes an internal Detroit Equity Council that publishes an annual report on city government activities. What data, whose report, and who is leading racial equity work in Detroit? We desperately need some shared measurements.
In 2014, I published an infographic and analysis that highlighted the inequity of resource access in the “revitalizing” city. Many residents noted it reflected what they experienced or had seen while many of the organizations and institutions [white-led] that I profiled pushed back against my analysis while still confirming the numbers were correct. In many cases, the fellowship organizations blamed their corporate partners who made final hiring decisions.
In Detroit, the leading “revitalization” programs still don’t represent the people impacted. The issue of structural racism is bigger than a handful of programs and fellowships, but these programs offer a critical reflection point. Many social problems function with a network effect and racial disparities in employment have been persistent. The fellowships reflected their corporate sponsors and foundation priorities similarly reflect their boards and leadership. Representation matters, but especially when those represented do not reflect the impacted community.
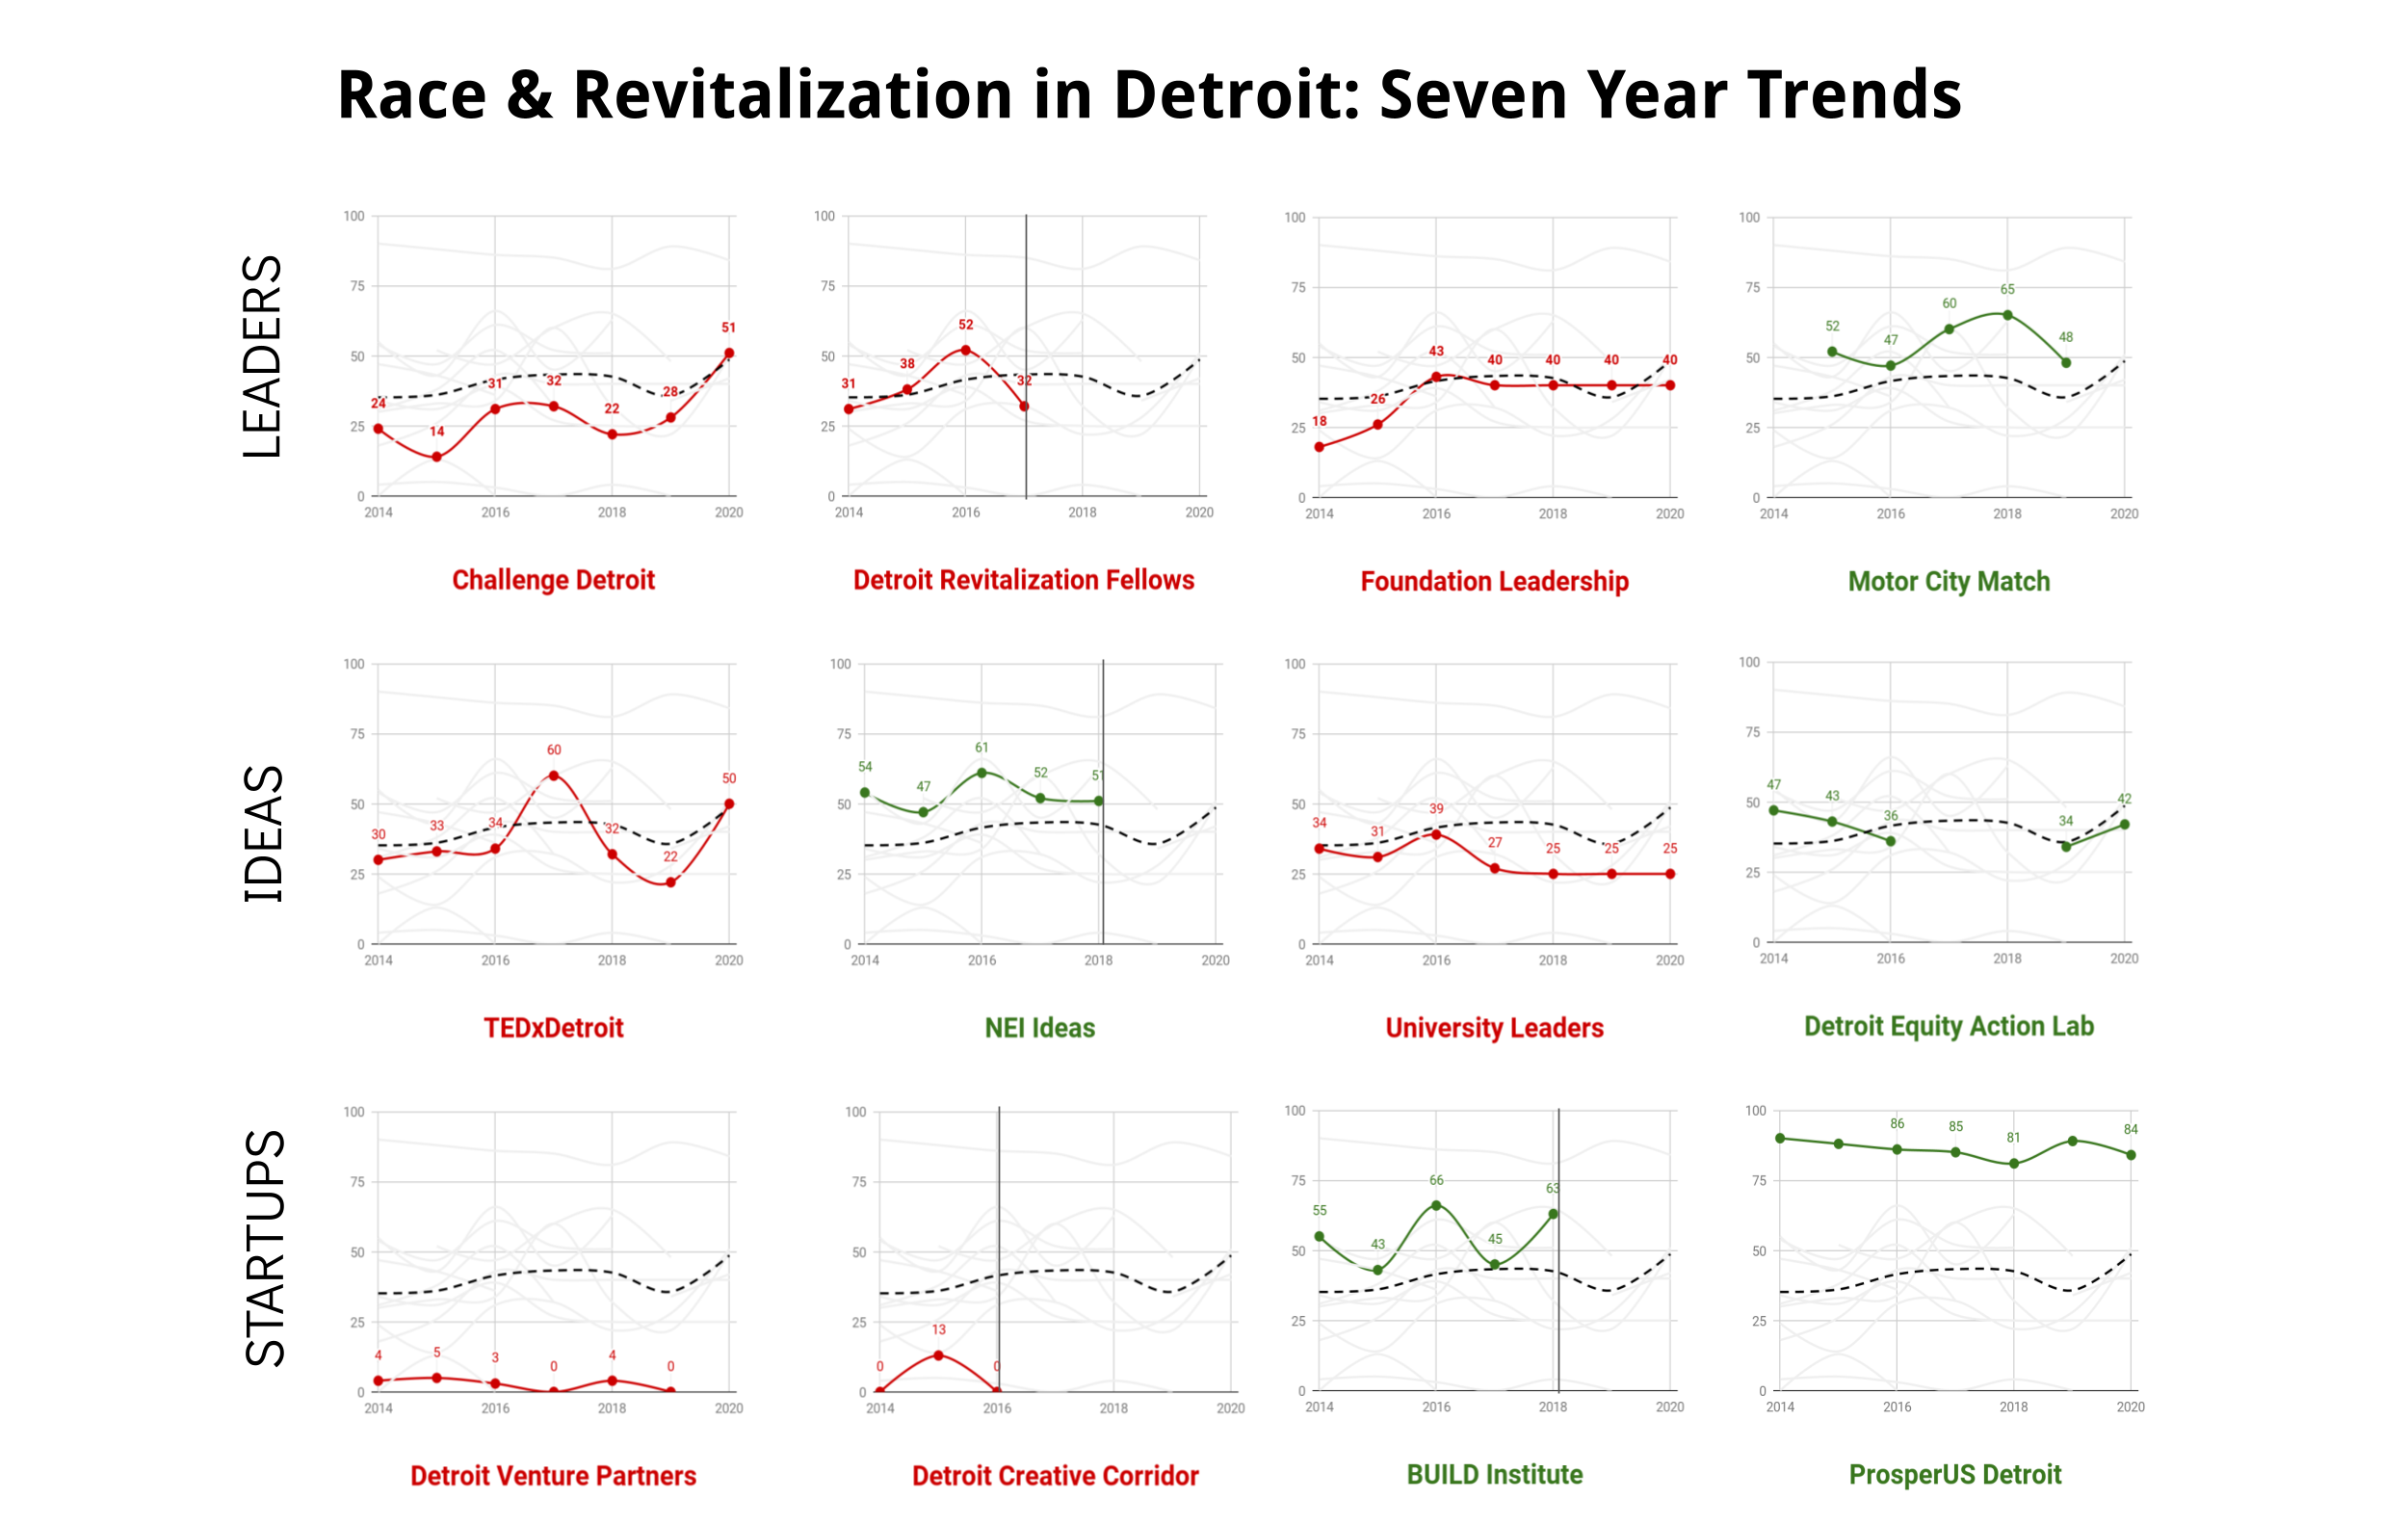
The 25% population loss between 2000 and 2010 was predominantly among Detroit Black middle-class households. On average, the city continues to lose around 5,000 Black Detroiters every year. The 2020 Census shows us that Detroit’s population continues to drop. In particular, Black residents have chosen to find opportunity elsewhere. These charts profiling various Detroit initiatives highlight Black representation specifically as Detroit’s largest racial demographic group at 77% (U.S. Census, American Community Survey, 2020).
Leaders of the Revitalization Narrative
The narrative of revitalization in Detroit is driven by foundations, fellowships, and funding.
Fellowships like Challenge Detroit and the Detroit Revitalization Fellows (DRF) expressly targeted young college graduates and mid-career professionals to come to Detroit. Both pushed back on my original analysis, but welcomed ideas to improve recruitment outreach. Challenge Detroit has been slowly improving representation among its classes of fellows, but dipped in 2022 to 25% representation. DRF saw positive change in one year before falling back to its old ways. The last DRF class was selected in 2017 and finished their fellowships in 2019. The DRF program is currently under-going major changes and updates.
Foundation leadership (specifically foundations that are Detroit-based or Detroit-centric in their work) saw a stagnation and no improvements in representation among senior leadership roles. This is notably different than nonprofits where representation is lacking, but Detroit nonprofits have better representation than foundation leaders.
The new addition in this category since 2014 is the Motor City Match (MCM) program, which was specifically designed to provide support for Detroiters in their neighborhoods. MCM supports both new and existing businesses. While the program came under scrutiny for its overspending on consultants, the representation among awardees was “above average” with a majority going to minority-owned businesses. The program halted operations during the investigation into its use of funds and has since restarted.
Ideas Creation
Idea generation comes from many corners, but speaker series’ and universities serve as hubs of new connections.
The TEDxDetroit speaker series is the most prominent and well attended of the various speaker series in the city. Over time the series has improved representation of speakers, but has had a hard time maintaining Black representation. The 2021 speakers fell to 30% Black representation and 2022 had 41% representation.
New Economy Initiative (NEI) Ideas bills itself on rewarding new ideas in business and entrepreneurship. NEI Ideas consistently supported Black-owned businesses in Detroit. Many NEI Ideas recipients get double-counted across programs like Challenge Detroit, MCM, and/or ProsperUS Detroit. To succeed in Detroit typically means tapping into multiple resources and programs all at once.
Black representation among Detroit-based university leaders dipped in 2016 and never improved. The majority of the city’s university leaders don’t look like the students in Detroit. DRF is also run by Wayne State University along with programs like the Detroit Equity Action Lab (DEAL) that brings together regional leaders with the goal of advancing racial equity. The program had a short funding gap, but came back with larger fellowship cohorts.
Startup Incubation
Detroit is not Silicon Valley. Programs like MCM or NEI Ideas could fit under this heading as well, but this will include some of the more traditional startup and tech support style programs – but not all are technology focused.
Detroit Venture Partners (DVP) is the most widely known venture capital investment group in Detroit. The firm, by its own stats, shows it has funded just one women-owned business and no minority-owned startups. In Detroit, one could assume there would be more diverse opportunities, but the long-running diversity issue in venture capital is not new. Google has set up shop in Detroit with plans to offer tech training programs in the renovated Michigan Central [Station]. The Apple Developer Academy also launched in Detroit with support from MSU.
Detroit Creative Corridor Center (DC3) existed for a brief period and faced similar issue with difficulty supporting a diverse group of creative businesses in Detroit. The program closed and pivoted to a wholly different program called Detroit Design Core, based at the College for Creative Studies, that leads on Detroit’s UNESCO City of Design designation and the “Month of Design” series of events.
The BUILD Institute has been a standout series of programs that truly served Detroiters and diverse businesses and entrepreneurs. The program regularly had high Black representation until it also took a break and moved into a new space called “The Corner” at the old Tigers Stadium site. Hopefully their full programming will return.
An addition since the 2014 analysis is the ProsperUS Detroit training program. The program is a powerhouse of being place-based, neighborhood focused, and supportive of Black, Latino, and multi-racial entrepreneurs. Since launching in 2012, 98% of program participants have been entrepreneurs of color. No other program in Detroit comes close to this level of representation for Detroiters.
Conclusions
Detroit has a long way to go when the city administration has regularly been hostile to community voices and concerns. The first white Mayor since before 1974 has toyed with discussions on race, but in turn contributed to mass disenfranchisement of Black residents. Task forces rarely have significant impacts on cities and people, but hopefully the Reparations Task Force can at least keep pushing the conversation and influence local foundations, nonprofits, and other programs to adopt an equity strategy in their efforts.
The overall trend of improving Black representation in revitalization focused programs and leadership roles has dipped again in 2022 with two large programs (Challenge Detroit and TEDxDetroit) lacking the gains in representation seen in past years. It is concerning that many of these programs have been unable to maintain consistency in their outreach efforts. It is surprising still that the city has yet to move the needle on offering opportunities for every neighbor to take part in the revitalization of the city. White people in positions of leadership and those who have benefited from these Detroit programs must do more to shift the city towards greater racial equity.