Map: The Shifting Cost of Coworking in Detroit 2014 to 2017

DETROITography

cowork_landscape_2017

Since 2014, I’ve been following the coworking trend in Detroit. I’ve used space for team work at An Office in Detroit that has seen a change in ownership, but is still going strong. In the last 3 year, there have been 8 coworking spaces that have closed and 13 new spaces opened, including the arrival of WeWork in two Downtown locations and the expansion of Bamboo Detroit into a second space. It is safe to say that the majority of the action is located Downtown within the 48226 zip code.

coworking-2017costchange

The most interesting coworking shift has been change in the monthly price of a drop-in desk or “hot desk.” Out of the 13 spaces that have been operating since 2014, 6 increased their prices, 2 dropped prices, and 5 kept prices the same (first map). In 2014 the average cost of a coworking desk was around $110, but in 2017…

View original post 101 more words

Map: Coney Detroit 2017

DETROITography

Coney-Detroit-2017-map

The coney dog was born in Detroit. The 2012 book titled Coney Detroit attributes the “coney dog” to Greek emigrants who likely passed through Ellis Island in New York (near the birthplace of the hot dog, Coney Island).

Coney dogs were cheap and quick allowing them to propagate outside of Detroit’s major factories. Workers had short lunches and limited budgets – the coney dog was the answer.

Today, there are multiple opportunities to eat at a Coney Island restaurant or diner. There are a few coney chains in the Southeast Michigan region and in the City of Detroit there are some coney clusters. Detroit’s Downtown is home to the Lafayette versus American rivalry, Northwest has Coney Islands right next to each other and includes Nicky D’s, while East of the State Fairgrounds sports a string of coneys mostly along Conant Street.

View original post

Map: Languages Spoken in Detroit Homes 2014

DETROITography

language-home-map

Households in Detroit in general are homogeneous; the city ranks low on the diversity scale due to the 83% majority African-American population. However, the city has incredibly concentrated neighborhoods of cultural significance. Detroit remains a global city.

Southwest Detroit is most often referred to as Mexicantown due to the large Mexican-American population that can be traced back for decades in the city. There was a small, but growing Mexican foreign born population in the 1960s (map). The increase in Mexican immigration was due in large part to the industrial jobs offered by Henry Ford. Mexican-Americans are currently the largest single immigrant group in Wayne, Oakland, and Macomb counties.

Warrendale, on the city’s lower Westside, neighbors Dearborn and has a similar history of Middle Eastern immigrants with the first coming in the 1870s. Various waves of immigration followed Middle Eastern conflict such as the Lebanese Civil War, the Gulf…

View original post 105 more words

Map: Home Range of the Detroit Pheasant

DETROITography

pheasant_range_map.png

For the last few years I’ve been thinking about Detroit’s most interesting bird around Thanksgiving time. Living near Brush St. and I-94, my dog and I would regularly see a male pheasant patrolling the vacant lots next to the expressway. This year I started working on the Eastside and on an almost weekly basis came across a pheasant flying in front of my car along Ferry St. before Mt. Elliott.

I started scrapping any and all online media that mentioned pheasant sightings in Detroit and included the data from WDET’s crowdsourcing (read more on the history of Detroit pheasants here too). For the analysis I had 109 sightings of roughly 300 pheasants in Detroit between 2002 and 2016. Some sightings were likely the same pheasant seen over and over again while others were just a lone bird out looking for food beyond its normal range.

Using inverse distance weighting…

View original post 88 more words

Map: Geography of Baseball Diamonds in the Detroit Region

DETROITography

terrapattern-baseball-detroit-regionTerrapattern recently launched to investigate typologies of similar places across cities via satellite imagery.

“…the Terrapattern prototype is intended to demonstrate a workflow by which users—such as journalists, citizen scientists, humanitarian agencies, social justice activists, archaeologists, urban planners, and other researchers—can easily search for visually consistent “patterns of interest”. We are particularly keen to help people identify, characterize and track indicators which have not been detected or measured previously, and which have sociological, humanitarian, scientific, or cultural significance.”

I decided to click on the baseball diamond at Tigers Stadium to see what places were similar in “Detroit” – Terrapattern’s sample area for Detroit includes a broader area beyond the city limits, but also cuts off the Far Westside.

terrapatttern-baseball
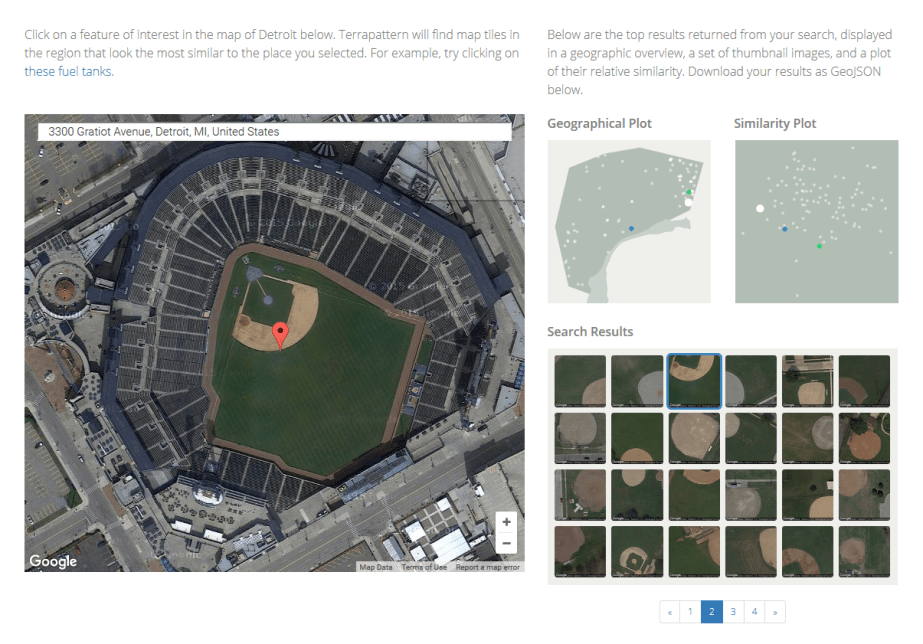
The result is this great geographic plot of similar images and a series of snapshots of other baseball diamonds. Terrapattern even gives you a nice GeoJSON file to play with if you…

View original post 68 more words

Map: Midtown or Cass Corridor? Responses from the streets of Detroit

DETROITography

midcassDuring the Data, Mapping, and Research Justice workshop offered in August, participants conducted their own data collection based on shared research questions about the Cass Corridor. One question in particular that was brought up was what different people called the area: Cass Corridor or Midtown.

In all 30 people were rapidly interviewed along Cass Avenue, 2nd, and Third Street. Sometimes the workshop participants’ data collection clipboards made people wary, but often the clipboards invited more questions making it easy to engage people on the street, at restaurants, and waiting for the bus. The participants didn’t make it further than Peterboro Street due to time limits in the data collection.

Cass Corridor11
Both3
Midtown16

Midtown was the more commonly referenced placename, but overall the data gave a fairly even representation of the area. If anything the responses collected from people shows the well documented debate over…

View original post 173 more words

The Future Geographers of Detroit Haven’t Yet Made a Map

DETROITography

In May, I had the honor and privilege to collaborate with the Detroit Future Schools program at the Boggs School to present a series of activities about data visualization. Our main goal was to visualize and understand patterns and relationships.

I ran the mapping activity where 2nd and 3rd graders identified where they lived, how far that was from school, and if they had any classmates who lived nearby. Many of the students didn’t realize they had a classmate who lived very close or similarly, how far some of their classmates lived from the school.

My favorite response to the map was:

“That doesn’t even look like Detroit.”

It is all too easy to get wrapped up in data, boundary lines, and “accurate” depictions of reality. Children can quickly…

View original post 41 more words